Stock Trading Alert........Click to Download Your Brochure (PDF)
How Else Would You Know Where Institutional Money Flows?
Spare yourself to go through hundreds of charts per day:
Apply an easy-to-follow, money-making investment technique, let our highly specific algorithms filter the market for you, detecting institutional activities:
- Pre-Market
- Last Hours
- Daily Basis
Book your Stock Trader Alert and you will experience, how to make Faster, Smarter, Better trading decisions using NeverLossTrading.
Included in the Stock Alert are:
Sing up or Register for your free trial today!
You will find:
- Stocks in a pre-price-move stage.
- Stocks were the price-move is already happening.
Our specifically developed algorithms detect:
|
|
|
|
|
|
|
|
Book your additional Investor Education Package and learn how you can participate with any type of account in up- and downside price moves and how to Hedge and Leverage your positions. Many investors believe that short-selling is only made for aggressive high risk takers. However, we will teach you:
- How you can participate when the markets fall with limited risks and high leverage.
- How to protect open positions without being stopped, turning potential losers into winners.
- How to leverage investments by compounding interest.
The NeverLossTrading Way
|
|
Sign up now or register for your free trial today!
Check out with PayPal Secure Payments. If you do not already have a PayPal account, opt for: No PayPal account? Pay using your credit or debit card (lower line of the page).
How Else Would You Know About Those Opportunities?
Find strong institutional price moves characterized by:
- NLT Change In Command Setups
- NLT Potential Tops & Bottoms
- NLT Early Trends
- NLT Range Breakouts
- NLT Extreme Volume Scan
- Preferred Scan (NLT internal)
- MO-Line Crossing (NLT internal)
- Magical Price Mover (NLT internal)
Read further to find those trade situations explained:
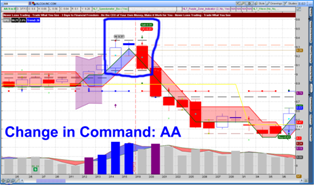
1. NLT Change in Command Setups
Find assets were institutions traded out and others traded into: In such an instance, and asset faces a strong change in ownership, commanding or controlling the action of the asset. and when a price move happens, you can spot it and trade along with it, applying various strategies:
Spot and Trade Key Swing Points: DIA Example from September 2013
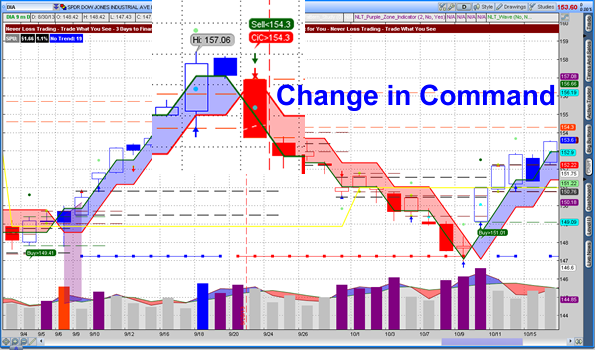
Spotting such happening provides one of the strongest directional trade situations: Some of our students compare trading for 1-SPU (the minimum expected price move after institutional engagement is detected and confirmed) to moving from base to base, while a “Change in Command Trading Setup” allows for a home run:
When key institutions are convinced about a good buying or selling opportunity, we can spot their decision and trade right along with them.
Potential Investment Strategy
Buying or selling one price-increment above/below the initiating impact candle.
Target-1 (minimum target): A price-move of 1-SPU (spelled out in the report).
When trading for a trend move, stop trailing is a good concept by putting the stop right underneath/above the trade initiating candle and move the stop up/down with the red NLT Double Decker Line (integrated in all NLT concepts) with
- a maximum risk of One Candle.
- and a maximum gain of Multiple Candles.
Examples:
Graph-1: KBH with Change in Command Trading Setup and Trend Move
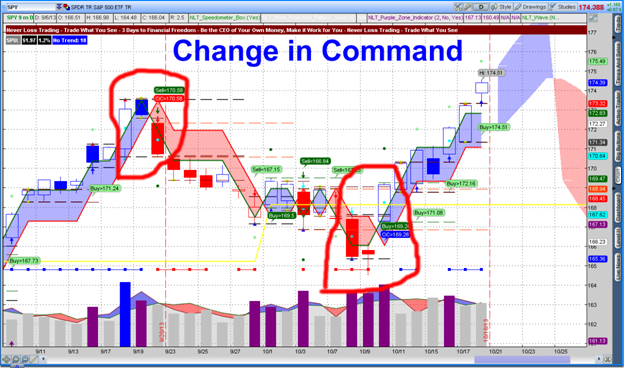
At times, institutions do not immediately show their investment strategy and produce one smaller candle in-between two NLT Light Towers. However, our charts, software and scanners find such situation and report it. Take a look at SPY-Chart (ETF for S&P 500), where we had such setups on September 18 -20 and October 8 - 10, 2013, resulting in a strong directional price move.
Graph-2: E-Mini S&P 500 - Candle in-between Change in Command Trading Setup
What it would mean to you, if you were alert about such a trading opportunities?
Subscribe now:
Some more examples:
Yamana Gold Inc.: July and Aug. 2013 |
Gold (ETF): August 2013 |
|
|
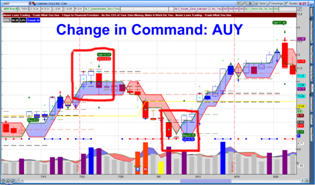
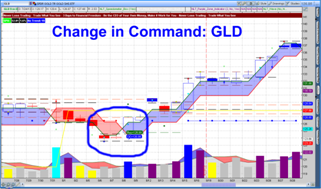
Subscribe to the “NLT Change in Command Alert” and receive the report one week for free ........click here.
Alcoa: February 2013 |
Netflix: October 2013 |
|
|
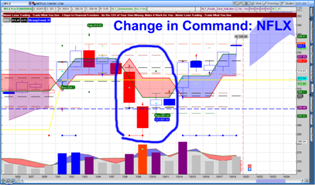
When the direction of the second opposite facing NLT Light Tower is not confirmed by the next or second next candle surpassing the set price threshold, there is no need to trade: The institutional engagement in the observed security was not confirmed by other market participants and we do not want to be in a trade.
2. NLT Potential Tops & Bottoms (Pink Signal)
This NLT-HF-Based-Signal-Configuration announces an early change in market pressure, which might lead to an opportunity of 1 - 2.5-SPU opposite directional price move. As always, signal confirmation is essential for a potential trade.
3. NLT Early Trend (Orange Signal)
This NLT Top-Line-Based-Signal (orange) helps you to find key channel points where the price has a high likelihood to retrace or revert, starting a new trend direction, where a trend trade potential might unfold. However, always consider key support- or resistance levels and that the critical price threshold has to be surpassed to validate the new trend direction
In the example above, the orange signals got confirmed by the price move of the next candle and resulted in a strong downside move for 1-3 SPU’s.
4. NLT Price Range Breakout
This study either works as a stand alone or in combination with other NLT concepts and spells out when stocks break a critical price range to the up or to the downside, offering a trading opportunity to follow the directional move for 1-SPU upwards.
5. NLT Extreme Volume Scan
Daily, we scan the markets for stocks, widely held by institutions which showed a strong change of ownership, characterized by a strong price move, associated with exceptionally high volume. To identify this potential trade setup, we use a cyan color volume bar:
Cyan Bar Example: Extraordinary High Volumes Exchanged for GOOG

Two types of happenings are differentiated:
Type-1: Strong upside price move associated with an extraordinary high exchange of stocks.
Type-2: Strong downside price move associated with an extraordinary high exchange of stocks.
After recognizing the happening, what are potential trading strategies?
Strategy-1: Trade with the Strong Upside Move
This is the easiest strategy to follow. A stock produces positive news, opens higher with extraordinary volume and the price move is followed through by other institutional investors. We then use our genius and trade along with the move.
The target for the trade shall be set at 2-SPU’s (two Speed Units = 2 x the expected daily price move at the cyan volume bar).
Another way to trade this situation is to trail the stop; however, after a 3-SPU-price-move, following the trade initiation candle, there is an 85% chance for a retracement where you might sacrifice already booked profits. Hence, profit taking is the right measure.
Strategy-2: Trade with the Breakout
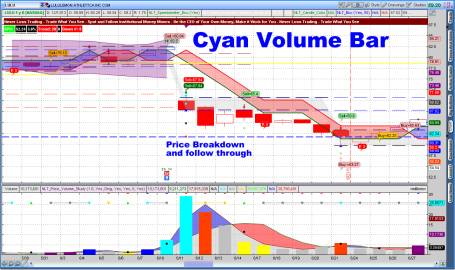
Even so the stock reported better earnings, the stock price broke down. Our Strategy:

-
Mark the high and low of the breakdown candle
-
Trade along with the price-breakout from the price range defined by the high/low of the breakdown candle.
In case the price breakdown gets followed through, we also trade along with the new price move for 1-SPU or 2-SPU’s.

Strategy-3: Trade Exhaustion on the Top
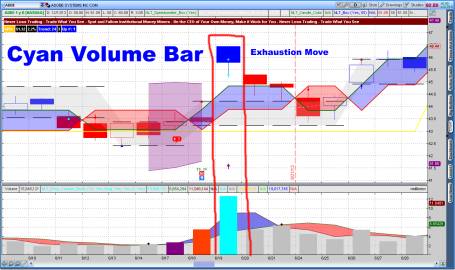

The price shows a strong upwards price move and produces what we call a trend exhaustion candle. This candle ends the uptrend, produces new owners, who quickly run away from the stock when prices fall. Our trade strategy again is easy: We trade along with the price move, when it breaks the low of the Cyan Bar Candle.
The NLT Swing Point Trading Alert combines all those studies, giving multiple earnings opportunities, reported on an excel sheet, where every indicator measure and trade situation is again explained.
Make a difference in your Trading: Sign up now for the NeverLossTrading Swing Point Alert!
Featured Trades
All information provided is based on the algorithms, indicators used in NeverLossTrading and does not represent trade or investment proposals. Please read the details of the Disclaimer and Subscriber Agreement.
Disclaimer
The risk of trading securities, options, futures can be substantial. Customers must consider all relevant risk factors, including their own personal financial situation before trading. In our teaching of how to trade the markets, in our newsletters, webinars and our involvement in the Investment Clubs, neither NOBEL Living, LLC, the parent company of NeverLossTrading® , or any of the speakers, staff or members act as stockbrokers, broker dealers, or registered investment advisers. We worked out trading concepts and share them through education with our members and clients.


 US Stock Market Holiday Schedule: