Fundamental Analysis
At times, there is a great debate about which type of analysis is better for a trader.
Is it better to be a fundamental trader or a technical trader?
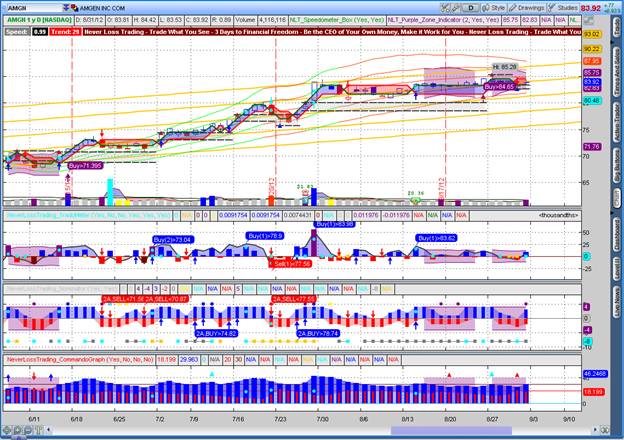
At NeverLossTrading, we made the decision to rely on technical indicators only.
|
NLT Relies on Technical Indicators Only
We leave the interpretation of fundamental data to institutional leaders and trade along with the direction they take.
Institutions are better informed and have access to a set of data, which will never get access to.
We are not taking chances and either leave stock positions prior to earnings announcements of find a form of protection if we want to stay in the trade. |
Fundamental Analysis
Fundamental analysis involves assessing the economic well being of an entity or the overall economy.
Indicators a stock trader would assess:
- Company’s earnings.
- Dept ratio.
- Sales development.
- And many other.
Fundamental traders will use those data points to determine the health of the company.
We leave the interpretation of fundamental data points to the analytic powers of institutional investors. When they decide that the data seen are favorable and invest in the share, we follow their lead. If institutions sell the shares, we follow and go short.
Fundamental data for stock market index-, commodities, currencies and treasury traders are
- The country’s inflation.
- Trade balance,
- Gross domestic product,
- Growth in jobs and even their central banks’s interest rate.
By assessing the relative trend of these data points, a trader is analyzing the relative health of the country’s economy and whether to trade the future movement of their currency.
Daily, we report which economic indicators on our web page: http://neverlosstrading.com/Weekly_Events.html
Again, we do not orient our trading on our interpretation, we pick up the consequences of economic news after the news are published and trade along with the new direction.
Technical Analysis
With our indicators, we follow the footprint of money on the price chart.