Algorithmic Trading with Human Interaction
All financial markets: Stocks, Commodities, Currencies, and Treasuries are dominated by more than 85% on Institutional trading or investment decisions. The NeverLossTrading® specific algorithms and indicators help you to spot and trade along with institutional money moves so they happen.
Experience, how you can use our algorithmic trading or quant trading model to find high probability trade setups on multiple tick-, range- or time-frames.
How can one predict the future price of a stock or other asset?
Historically, technical analysis is used to predict a future happening on the price chart. The first technical analysis is reaching back to the 1600’s, when “Japanese Candle Sticks” started their development in tracking historic price moves to predict the price moves to come. Japanese is one of the most graphical languages on the planet. The western world casually say candle sticks to the graph, which expresses a relation of the high, low, open and close of the price, painted over a period of time or contracts closed. The Japanese word for the graph is TAKURI, meaning "trying to gauge the depth”. Another interpretation: candle sticks are the “footprints in the sand of a price move”. Our days, commonly, technical analysis is used to predict a future happening on the price chart.
Times changed and we can leave the technology and analysis of the past behind us. Today's trading-platforms and computer technology allows the private investor to use complex algorithms to filter and portrait assets with potential directional price moves, putting you at par with the big investment houses of the world.
How else would you know, which of the 42,000 assets traded in the US are of institutional interest?
Latch on to today's trading world and use the leading edge technology of NeverLossTrading® to your trading/investing advantage.
The NLT-Price Move Model
How far can price patterns be predicted?
We consider two major and conflicting theories:
Theory-1: There is a price behavior, which repeats itself.
|
|
Repeating Price Behavior Theories: Head and shoulders, flag patterns, cup and handle and many others are patterns that are recorded and assumed that they repeat themselves. Our studies and documentation show that the probability of an assumed pattern to conclude is in the range of 55% - 59%.
|
Theory-2: The price behavior is random and cannot be predicted.
|
|
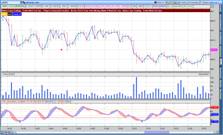
Random Price Distribution Theories often rely on a Markov chain, where the price development is random, but in the vicinity of an expected statistical price distribution.
|
The NeverLossTrading Algorithm or Quant Model
NeverLossTrading® considers price patterns and random price behavior, while an independent price-behavior model was developed:
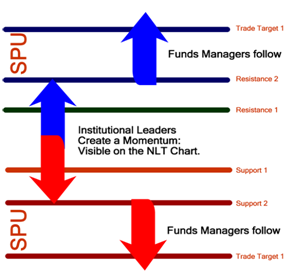
Key to the NeverLossTrading® pricing model is the institutional price move, which is detected and reported by assuming “crowd behavior”: Leaders initiate a price-change and followers jump on the new direction, defining our price-entry-point from where the potential future price-point in the natural distribution of prices is extrapolated and traded. The trade orientation is rather short-term: 1-5 bars, in reference to the time-, tick-, or range-unit observed: Individual price moves to the up- and downside are traded.
|
|
With NeverLossTrading, we built a natural behavior model, which considers repetitive action in behavior of leaders and followers: The crowed is following the leaders. With our mathematical models, we translated this into a trading plan, with defined entries and exits, where the price behavior on the chart is sectioned in:
- Purple Zones: Times where a rather random price behavior with counter trade activities is expected.
- Blue Zones: Dominant to Upside Price Moves
- Red Zones: Where Downside Price Moves are Dominant
MSFT Price Chart With Purple Zone
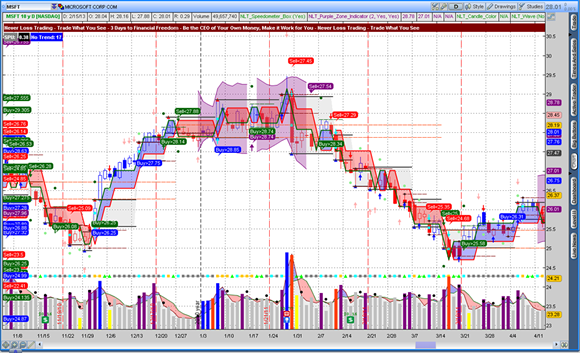
NeverLossTrading uses a proprietary model of price behavior to measure and point out high probability trade setups, where institutional investors make a move.
Let modern algorithms and data-bases filter out trading opportunities for you, while you stay in the ultimate control to make the trading decision.
To be part of this, check contact@NeverLossTrading.com or call: +1 866 455 4520.
 |
 |
Trade or Invest with the institutional money flow: Stocks, Commodities, Currencies, Treasures and their derivatives: Futures and options...click here. |
Six-months of coaching: Individual training units; all software installed; all questions answered in the same day; constant feedback and education. |
Professional Investing and Trading Education
|
Find Yourself |
Your NLT System |
Specifics |
|
Are you interested in day trading, looking for a reliable algo- based trading system where you stay in control of the ultimate decisions? |
|
Early entry
Confirmed entry
|
|
Are you seeking an advanced algorithmic online trading system with human interaction to trade once or twice per week? |
Trend trading
Easy trading |
|
|
Is stock trading your favorite and you are rather a swing trader, ready to open and close positions every 1-5 days? |
Frequent trading
Early entry |
|
|
Are you serious in online trading or investing and you want to scan and screen the markets real time,, using your own searches, watch lists and portfolio management? |
Strongest signals
Market relation
Own scanners |
|
 |
Do you find yourself in all above? | Combine NLT Systems.
We tailor to your trading style. |
Consult with us for your fitting day trading and swing trading systems. |
|
Are you looking for an introductory algorithmic trading system to spot and follow institutional money moves for day trading and swing trading , applicable for all time frames and asset classes: Stocks, Commodities, Currencies (FOREX), and Treasuries? |
Introductory Day Trading and Swing Trading concept.
Fully refundable on upgrades to NeverLossTrading. |
Momentum trading
Trend trading
|


Best regards,
Never Loss Trading
Disclaimer
The risk of trading securities, options, futures can be substantial. Customers must consider all relevant risk factors, including their own personal financial situation before trading. In our teaching of how to trade the markets, in our newsletters, webinars and our involvement in the Investment Clubs, neither NOBEL Living, LLC, the parent company of Never Loss Trading, or any of the speakers, staff or members act as stockbrokers, broker dealers, or registered investment advisers. We worked out trading concepts that benefit us greatly and share them through education with our members and clients.


 US Stock Market Holiday Schedule: