Do You Have A Business Plan for Your Trading?
A business plan is a formal statement of a set of business goals compromised by a financial plan and action plan. It shall contain:
- The reasons your goals are believed to be attainable.
- Action steps to be taken for reaching those goals.
- Background information about the resources needed to reach those goals.
- Financial return on investment statement for specified time periods.
Do you have such in place as a trader or private investor?
Mostly, this is not the case and so we are sharing the action steps and start out with the Financial Plan; based on the money, we then produce the required action plan.
How much money do you want to make trading/investing?
As much as possible is not the right answer:
“If you don’t know where to go, you might not get there”.
To establish and follow a business plan, starting out with what, when, how questions is a good place to start:
- What time-frames can I and do I want to trade?
- Which instruments do I want to trade/Invest in?
- How will I administer my trades (entries, exits) and strive for continues improvement?
- What alternatives do I have; how to appraise those and chose the best fitting for me?
For a plan to be laid, some decisions have to be made:
Decision-1: Time Frames to Trade
What time of the day and how much time can you or do you want to dedicate to trading?
Full time traders have a different time portfolio to draw from than people, who have a day time job; however, both meet professional market participants and need to prepare for success. By your ability to auto-send orders, when certain conditions are fulfilled, you can basically trade all instruments and a combination of them at many of the available and meaningful time frames.
Another time-based decision to make is from which time based or tick based chart, you are taking your trade decisions: Your trade frequency multiplied by the expected price moves you aim for, strongly influences your financial expectation.
Decision-2: What are expected returns and associated risks that result off your choice of trading frequency, trading instrument and time of the day?
As a swing trader, you might focus on weekly or daily charts and expect three to six trades per month. As a day trader you focus on lower time periods or a combination of day- and swing trading and potentially 80 trades per month. Your decision on time frames for trading decisions influences your return expectation. See the following example:
A stock with an average price move after a trade setup of 1.8%, on a daily-chart, produces an average price move of 0.7% on a 1-hour chart. When trading this stock from a daily perspective, your average expected weekly return can be assumed at 1.5-turns x 1.8% return = 2.7%/week or 10.8%/month. If you trade the 1-hour time frame with an average of 4-turns per week, your expected return is 4 x 0.7% = 2.8%/week or 11.2%/month. Both results show a similar outcome; however, with a very different base hypothesis and trade action.
Decision-3: Use an evaluation model to consider the associated risk per trade and the expected probability for success. With that, you can calculate the odds ratio, which helps you to define the position size of a trade. The following model gives a short overview, how such can look like on the base of trading a stock or the referring option:
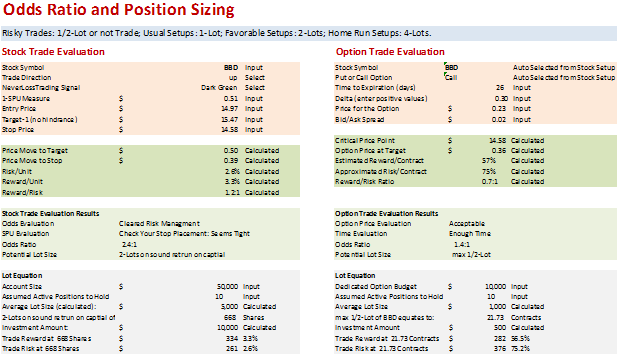 The example of the BBD share shows, that the stock trade has a more favorable trade setup than the option trade; thus, potentially investing into 2-lots on the stock trade and maximum 1/2-Lot in the option trade (if you even accept the option trade), results from the calculation scheme.
Decision-4: Which instruments do you want to trade: Stocks, Options, Futures or FOREX?
Associated with the choice of the trading instruments and time-frame is the need to calculate:
- Meaningful minimum price moves to aim for and the financial implications of those decisions. As a private investor, never aim for a stock or option price move below 17-cents. If you trade below this minimum expected price move, commissions, slippage and some trade imperfections require you to find trade setups with a probability for success above 75% for breakeven.
- Maximum risk to accept per trade. There is no 100% system and you need to learn to be your own risk manager, with clear rules of how much maximum drawdown, you allow for a trade when the worst case happens. This then defines your position sizing and instrument choice.
- Trading time table and action: When and how do you find assets with favorable price action and trade signals: You want to trade where money moves and staying just with one instrument or asset class is not a good choice.
Decision-4: Consider different market conditions in your business plan.
The best for you to categorize financial market conditions is to look at the VIX:
VIX is a trademarked ticker symbol for the Chicago Board Options Exchange Market Volatility Index, a popular measure of the implied volatility of S&P 500 index options. Often referred to as the fear index or the fear gauge, it represents one measure of the market's expectation of stock market volatility over the next 30 day period.
Condition-A characterizes an average or increased volatility, at VIX-levels above 15 and below 30. The stage, we call Condition-A, allows for excellent positioning trading as a swing trader or long-term investor.
VIX Index 10-Year Chart
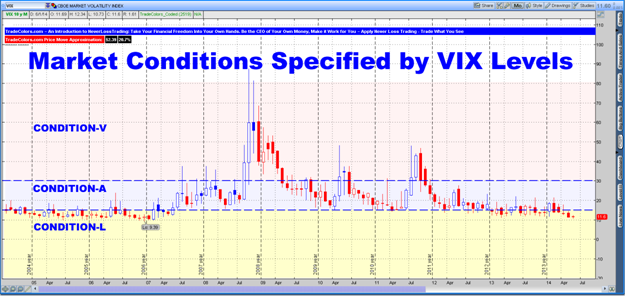
Condition-L: In a low volatility market environment, we see the VIX below 15: Financial instruments produce smaller-, often in-range price moves. As a result, you can expect less attainable trade targets and lower associated risks. The current state of the stock markets is in Condition-L and longer-term position trades are harder to administer, expecting that highs and lows of a tight price range are constantly tested. As a consequence, changing strategies from position trading to trading lower time frames is a meaningful course of action, letting you catch intra-day price actions to the up- and downside. The consequence of changing trading time frames means that you are trading for smaller price moves. For attaining the same financial returns, you need to increase your trading frequency as shown under the point: Decision-2.
Condition-V: Volatile market environments, where VIX ranges above 30, show an increased risk for price moves towards the range borders, where stops might get easily challenged. As a consequence, like in Condition-L, trading shorter-term frames is a good choice to make.
Putting it all together let us produce a short business plan, considering a full time trader with a $100,000 trading budget, 99% invested (no margin applied), who uses various assets and trading time frames:
- Stocks: Daily, 4-hour, 1-hour chart.
- Options: Daily, 4-hour chart.
- Futures: 10-minute chart.
The model used, considers commissions and calculates the risk and reward, expecting a 66% win rate. In the model, we filtered out option or stock constellations, which will not produce positive results. One example would be: Trading for a 5-cent option price gain at a 1:1 reward to risk setup. When you consider commissions, you can expect a 2-cent net return. In a case of a loss, 7-cents will be drawn. Such trade setup would require an above 80% trade accuracy to produce income, which cannot be achieved by winning two out of three trades.
On the right side of the table, you can see, how different the potential reward and risk per trade is in relation to the trading time frame and frequency.
Investing $30,000 into a stock trade with expected six turns per month, on a rate of two winners and one loser, produces an average expected return of $1.056 per month. If you turn $3,000 invested into options the expected dollar-return is about the same; however, every option trade carries a 2.4-times higher risk, even so only 10% of the investment money used for stocks was associated.
For day trading Futures, we decided for a 10-minute time frame and associated three trades per day and with a two out of three win-rate, which results in an expected $2,000 return on $10,000 invested (total margin). In this case the risk per trade is $189.
Every trader has a difference risk tolerance and return expectation. Balancing reward, risk and the resulting outcome, such model helps you to decide, where you want to put your trading focus and how you can make the best use out of your money to invest. The choice is yours, either build it on your own or trust a trading system, which delivers the model to you:
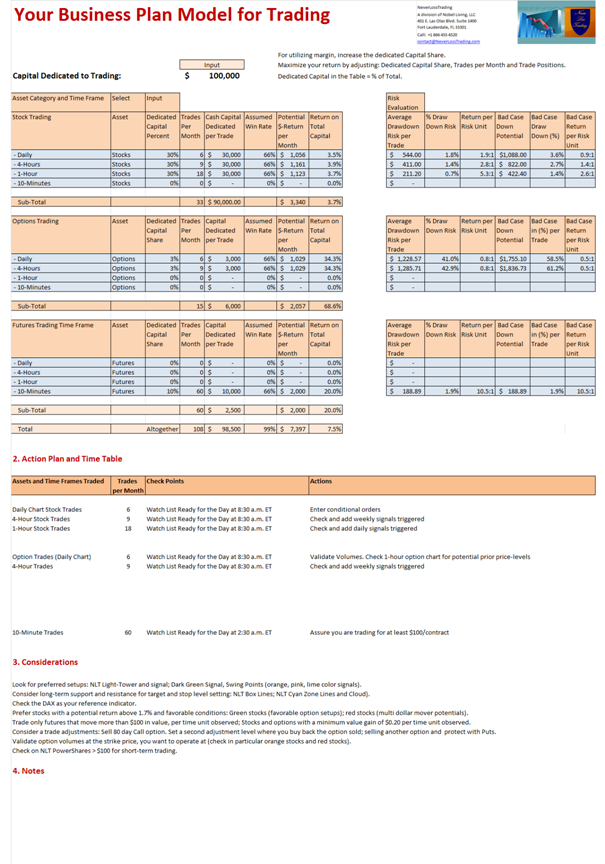 The above table auto-developed from financial model your action plan for the trading day and gives you the key considerations to strive for a constant income and wealth from the markets.
To participate in up-and downside price moves, trading strategies, which allow you to do so from any account are key to be a successful trader or private investor.
To be part of the NeverLossTrading users, schedule your personal consulting hour, where we help you to find the system and mentorship which suits you best.
Let us know when it is a good day and time for getting together:
Call: +1 866 455 4520
Good trading,
NeverLossTrading
A Division of Nobel Living, LLC
401 E. Las Olas Blvd. – Suite 1400
Fort Lauderdale, FL 33301
Disclaimer


 US Stock Market Holiday Schedule: